How to build a clickable, multi-floor house plan
Sep 14, 2025 · 10 min readLearn how to create a complete presentation of a real estate development with a map, clickable floor plan and interactive hotspots.
Flat images can’t guide, inform, or convert. An interactive floor plan with hotspots, popups, and floor switching turns browsing into a short path to “Book a viewing.”
Let’s rebuild the house floor plan above. It uses two exterior views and three floors. You can click a floor on the exterior to open its plan and view more information about each room. You can also move between floors using the select on the right, or from the drawer menu on the left.
We will shamelessly use our very own no-code floor plan builder MarkerKit.
Create your project
After creating an account, open your dashboard and create a new project. Choose Image as a starter template and upload the exterior view of the building. We will be adding more artboards later for floor plans and a map with the property’s location.
After you created your project, you will be taken to the Artboards & Objects tab. Here you can add, remove, and manage artboards and objects. There are three types of artboards: Image, Map, and Solid Color.
Add floor plans and draw SVG polygon hotspots
Add a few more Image artboards, one per floor, and set their images. Rename them to something clear like Exterior, Floor 1, Floor 2, Floor 3.
Note: These names are visible to the end user in the artboard switcher and drawer menu, so keep them short and descriptive.
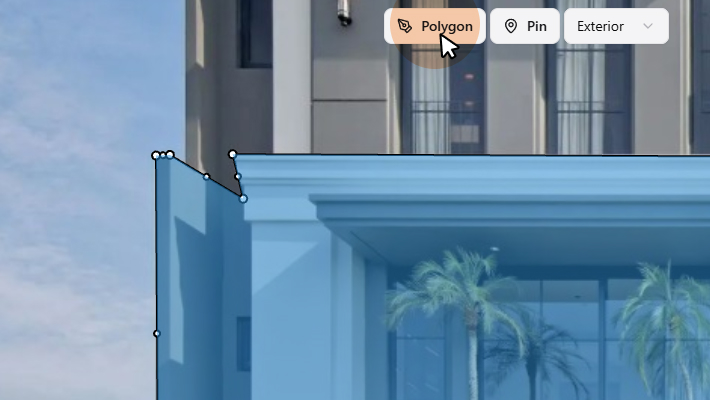
On the Exterior artboard, draw a polygon over each floor area that should be clickable. Click the Polygon tool in the toolbar (or press
Multi-floor navigation: click to change view
To make navigation easy and intuitive, we will make each polygon link to the corresponding floor plan. When the user clicks a floor on the exterior view, they will be taken to the respective artboard.
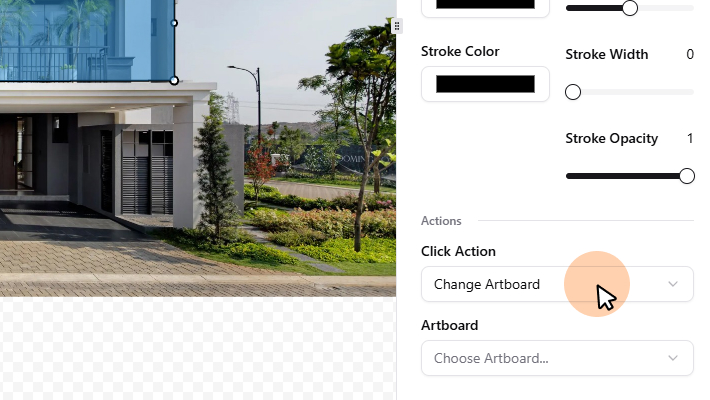
Select a polygon on the Exterior artboard and scroll down to Actions in the object settings on the right. Set a click action to switch to the target floor artboard and repeat for the remaining polygons.
At any point you can open the Preview tab to verify that the linking works correctly.
Create floor popups
In MarkerKit, popups are independent objects that can be attached to any object. You can add title, description, an image, or a button to a popup. The popup needs to be attached to an object to see it on the artboard.
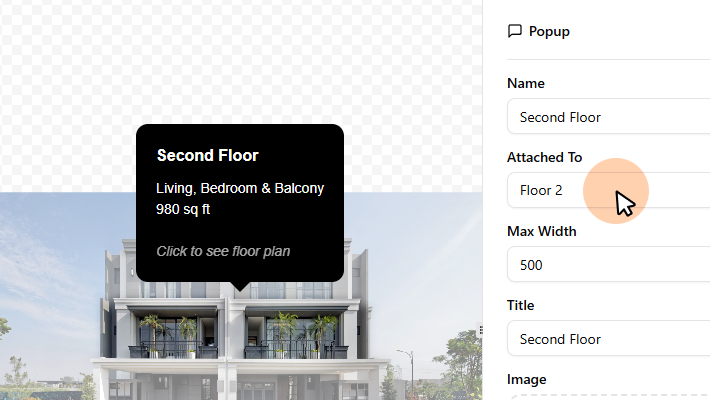
Create a popup on each floor artboard with a short title and a short description. In this example we have images on some popups too.
TIP: You can set a maximum width of the popup. This is useful for when you have a lot of text, or a large image. By setting a max width, the content will scale nicely and will be less awkward near the edge of the viewport.
We will also customize how popups open. Since in this demo we don’t have buttons in the popups, we can safely make them open on hover. Head over to Settings → Popups and set Show Popups On to Hover. With these settings, you’ll end up with a floor plan with popups that feels fast and informative.
Set hover effects in Settings
In the demo preview at the top of this post, you might have noticed that the image slightly fades when you hover over an object. These floor plan hover effects help the user focus on the target object and add visual polish.
It’s a good idea to take into account the background of your website when choosing the color of the mask. For example, this blog has a white background, so we used a white mask. If your website has a dark background, consider using a dark mask color.
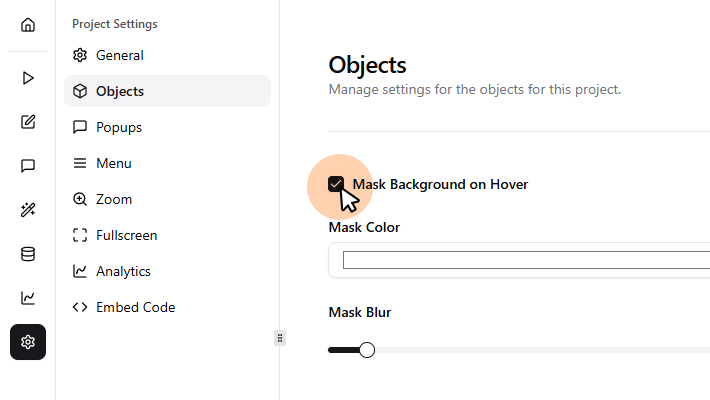
Open Settings → Objects and enable Mask Background on Hover. You can customize the color of the masked area, the edge smoothness (mask blur), and the opacity. For this demo we used a white mask with 15px blur and 0.5 opacity.
Alternative to masking: simple hover effects
If you prefer a simpler effect, you can disable the mask and instead go back to the Artboards & Objects tab to customize the hover effect per object. You can change the color, opacity, or add a border. This is a good option if you want to keep the original image fully visible.
In this demo we went for both. A hover color for each object gives it more contrast over the black and white floor plans.
Enable the drawer menu
Besides the floor switcher on the right, notice that the demo also has a drawer menu on the left. The menu is a useful navigation element that lists all objects and allows the user to quickly jump between them. You can also enable a search box to help find objects in large projects.
Open Settings → Menu and enable the menu. Feel free to explore the settings and find a style that fits your website and use case. There are three main styles:
- Inline: A sidebar that is always visible on either side of the widget. Best for widgets with few objects, where you want to keep navigation always visible.
- Drawer: A hamburger icon that opens an Inline style menu on click.
- Aside: A sidebar that is always visible on either side of the widget. Best for widgets with a lot of objects, where you expect the user to frequently switch between them or use the search.
Note: On mobile devices, the menu is always a drawer and opens in fullscreen mode for optimal usability.
Embed the floor plan on your website
When you are happy with the result, head over to Settings -> Embed Code and copy the
Here is an example of how to embed it in a simple HTML page:
Create a location map for your property
As a final touch, let’s add a map showing the location of the property. This gives context to the user and helps them understand where the property is located. You could create the map as another artboard in the same project, but for this example we want to put the map elsewhere on our website, so we will create a separate project for it.
Click the Home button to go back to your dashboard and create a new project. This time, choose Map as the starter template. You will be taken to the Artboards & Objects tab and there will be a single Map artboard already created for you.
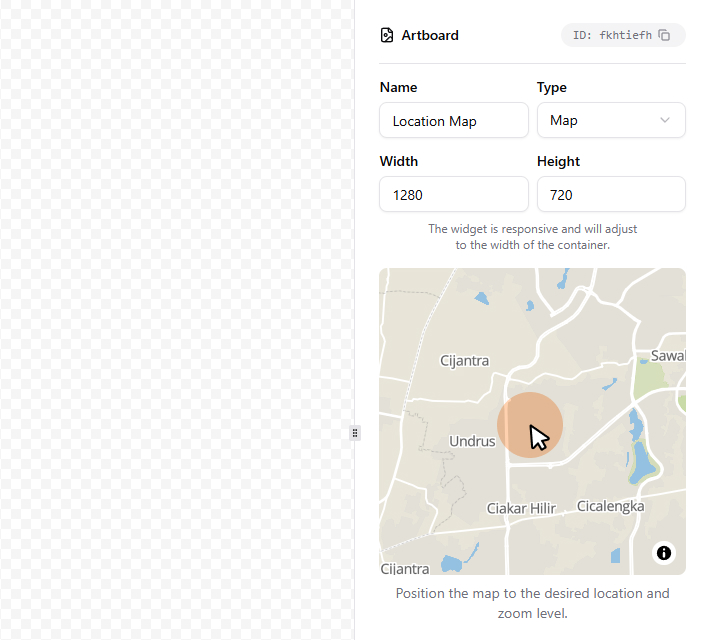
In the details sidebar you should see a preview of the map. In order to set the location and zoom level, simply drag and zoom the map in the preview.
Note: The preview accurately represents the zoom level, but not the final crop area of the map. That depends on the size of the widget on your website, (the widget is responsive).
To mark the location of the property, you can add either a Pin or a Polygon object. In our demo we used a simple Pin. Click the Pin tool in the toolbar (or press
Adding a popup and installing on your website works the same way as with the previous project.
Go further with live data sync
So far we created an interactive multi-floor house plan with clickable floors and informative popups. You can take this further by adding live data sync to keep availability, pricing, or other information up to date.
Although you can do it without writing any code, it’s an advanced feature that deserves its own tutorial.
One final tip: In Settings → Analytics you can enable the MarkerKit Analytics to track user interactions with your artboards and objects. This way you can see which floors or units are most popular, how users navigate through the plan, and optimize your content accordingly.
That’s it! You now know how to create an interactive, multi-floor house plan from start to finish. Try it out with your own real estate projects and see how much more engaging your pages can become.
Turn your static images, maps, and diagrams into interactive experiences.
Get started with MarkerKitNo credit card required.
floor plans, and diagrams.